Live EUGovernmentDebt Map
Add together the public debt of all 27 EU countries and you get the figure below: a live estimate that keeps moving every second.
EU Debt Map turns Eurostat debt data into a simple way to explore government debt across the European Union. Use the interactive map to compare countries such as France, Germany, Italy, Spain, and the Netherlands. Then open any country page for a live debt ticker, recent trend, and debt-to-GDP context.
Source: Eurostat. Live values are estimated from the latest quarterly data and are shown for educational purposes, not as official real-time statistics.
EU overview
The map shows whether government debt has risen or fallen between the latest two reference points. Open any country to see its live debt estimate, recent movement, and country context.
Quick list
- 🇦🇹 Austria — ↑ rising
- 🇧🇪 Belgium — ↑ rising
- 🇧🇬 Bulgaria — ↓ falling
- 🇭🇷 Croatia — ↑ rising
- 🇨🇾 Cyprus — ↑ rising
- 🇨🇿 Czechia — ↓ falling
- 🇩🇰 Denmark — ↓ falling
- 🇪🇪 Estonia — ↑ rising
- 🇫🇮 Finland — ↑ rising
- 🇫🇷 France — ↑ rising
Latest articles
View all →
EU Debt Burden in 2026: Which Countries Are Under the Most Pressure?
Eurostat’s Q1 2026 data puts Greece at 143.5% of GDP, Italy at 138.9% and France at 117.6%. See which EU debt ratios rose fastest and what the figures mean.
Read more →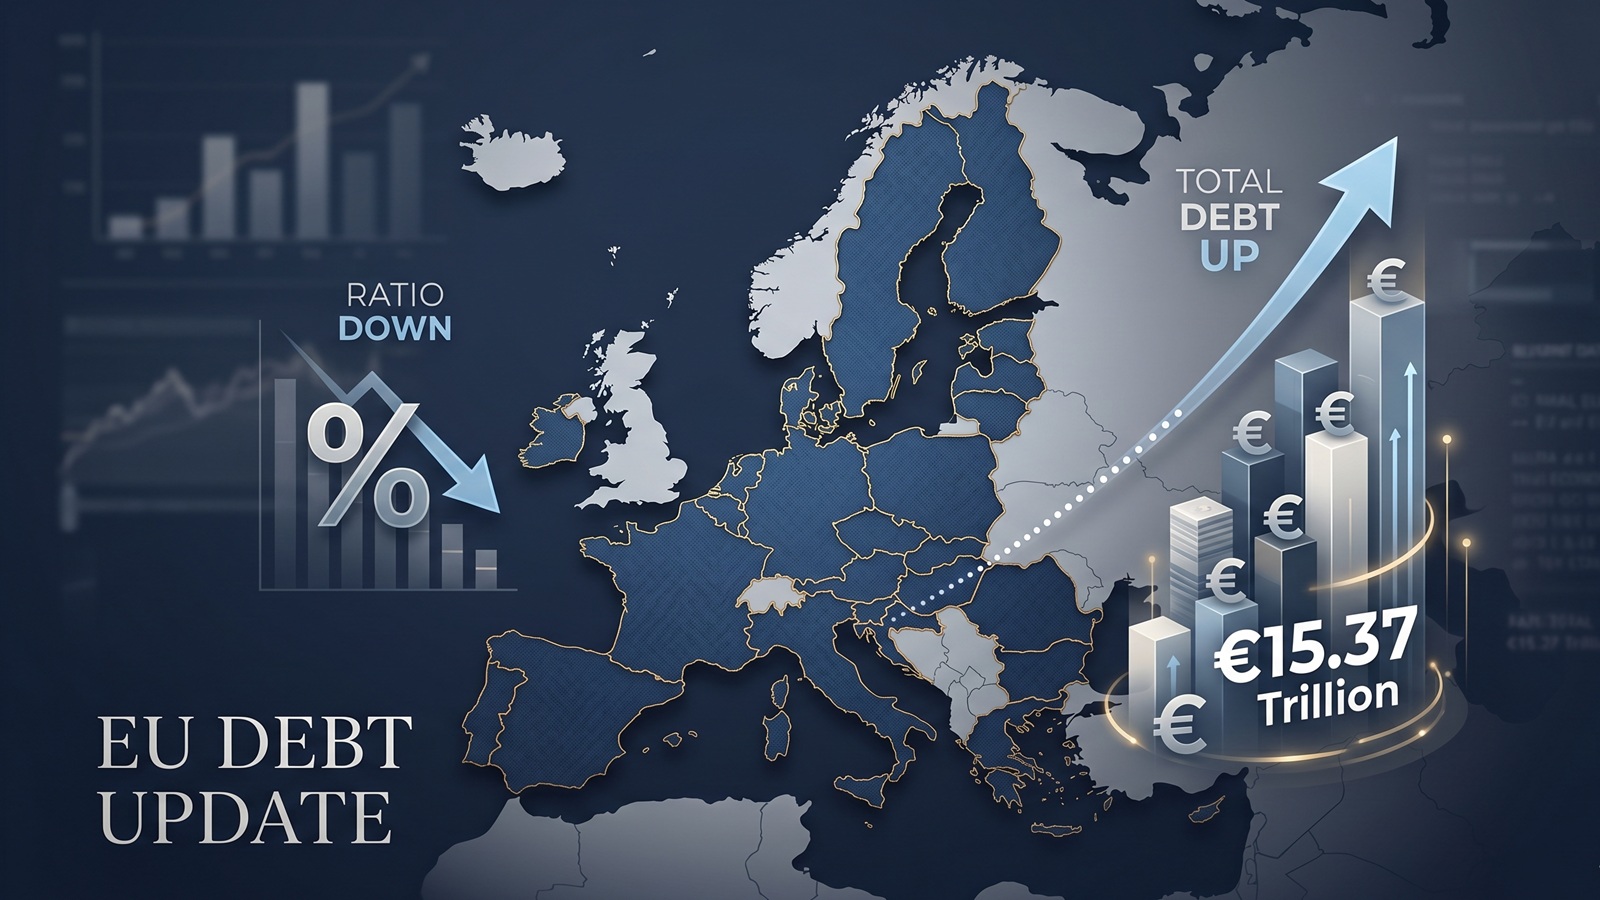
EU debt update: the ratio fell, but the pile still grew to €15.37tn
The latest Eurostat release offers a picture that looks calmer than it really is. The EU debt ratio edged down in late 2025, but the total stock of government debt still rose to more than €15.37tn.
Read more →
EU Debt Explained: Why Adding It All Up Helps, and Misleads
Add together the public debt of all 27 EU countries and the total comes to more than €15 trillion. That number is useful, especially on a live map, but it can also mislead because Europe does not borrow like a single country.
Read more →